
Accounting Insights: Alibaba, JD, and the $330bn Footnote
A case study on how to utilize financial disclosures to better understand a business

This piece follows our prior Memo on 1P vs 3P accounting, which you can find here. This post goes into details on how to piece together financial disclosures to build novel company insights. We go through JD’s disclosures back to 2015 to better understand Alibaba’s ability to monetize their platform. It is our most accounting intensive piece yet, but we believe readers will learn a lot from it!
Most investors have heard about how important it is to “read the footnotes”, but few have had any experiences in it actually making a difference to their investment thesis.
To highlight the importance of footnotes, in this post we go through a real world case study of Alibaba to show how financial disclosures can potentially change an investor’s understanding of a business’ future prospects.
It is an especially interesting story that most investors missed, because the disclosure that shed light on Alibaba’s financials were actually given by a competitor—JD—and that was back in 2015.
This is both an argument for thorough diligence and why historical documents can have a bearing on the current business.
With that, we will begin with some high level accounting concepts and then go through what the footnotes revealed about the businesses. It is worth noting that everything we mention here was in-line with typical accounting guidelines and the real focus is on what an investor can do to sharpen their business analysis skills.
Alibaba High Level Figures.
We’ll start with Alibaba’s 2021 investor presentation. Here, we see that China GMV is RMB ~7.5tn, or about USD ~1.1tn. For context, Amazon was estimated to be around $500bn.

For the uninitiated, GMV stands for gross merchandise value. This is theoretically the economic value of all transactions on their platform. (It’s important to note that GMV is agnostic of whether it is a 1P or 3P transaction. For more on that distinction and what GMV is, see this prior essay).
Now, investors like to look at GMV because it gives a sense of how much economic activity a company is facilitating. The more economic activity, the more opportunity to monetize, whether it be through offering services, increasing their sales commission, or something else.
Below is a table of Alibaba’s China Retail Revenues. (For those familiar with the company, we only included Customer Management Revenue and Commissions, and not the “other category” because of 1P transactions, which are a small portion of GMV but distort the monetization rate). In short, China Retail Revenues are revenues Alibaba derives from advertising and commissions for their main Chinese platforms: Taobao and Tmall.

We see at the bottom the GMV Monetization Rate (this is also typically called a “take-rate”). This is calculated simply as China Retail Revenues over GMV. It is a good rough approximation for how much value of each transaction Alibaba is taking. A 4% Monetization Rate means that for every 100 cents, they keep four.
If you stopped your analysis right here, you might compare Alibaba to other global ecommerce players and see that 10% is a standard minimum, and many players can hit mid-to-high teens when layering in advertising. While China’s competitive dynamics are different, would you conclude they were over-earning or under-earning? Or in other words, is Alibaba charging fees that are unstainable in the long-run, or are they operating at a reasonable to potentially low Monetization Rate that implies they have the ability to increase their fees?
Keep that 4% figure in mind. It’ll come up again soon.
But for now, we will move on to an Alibaba competitor, JD, before returning back to Alibaba.
JD is another leading ecommerce player in China. One of the big distinctions between Alibaba and JD is that JD owns their own logistics and fulfillment network, and was historically only a 1P platform before letting 3rd party merchants sell on their site in 2010. (Virtually since JD’s inception, it has been an underdog relative to Alibaba. While it has been gaining some ground, they currently have less than half of Alibaba’s reported GMV.)
JD’s GMV Disclosures.
The confusion with GMV starts with the fact that the “industry accepted” definition is a flawed metric. To JD’s credit, they tried to improve it, but only exacerbated the confusion in the process. At one point, they had 3 different GMV metrics: Core GMV, “JD defined” GMV, and then “industry” GMV.
To start, Core excluded Paipai, a C2C platform acquired from Tencent in connection with Tencent’s JD investment. Paipai was relatively small, and the difference between the two was around ~5%. Paipai was eventually shuttered and we will ignore the impact of Paipai for the rest of the GMV discussion, as relative to the other factors that affect GMV, it is trivial.
This leaves “industry” GMV and “JD defined” GMV. The variance between the figures was significant, with “industry standard” GMV being ~40% higher than “JD defined” GMV (RMB 939bn vs. RMB 658bn for 2016).
Why was this the case?
To keep things simple, we will focus on two GMV metrics that we will call Method 1 GMV and Method 2 GMV. Method 1 GMV used to be their main metric until 2017, at which point they switched to Method 2. The Method 1 GMV is what we were referring to as “JD Defined GMV”. Method 2 GMV is what we were referring to as “industry” GMV. We can draw much insight from the few years they reported both in the footnotes.

As shown above, there are two GMV metrics JD reported for 2015 and 2016. These are the only two years we have full annual numbers (partial years in 2014 and 2017).
To help simplify, we will solely focus on annual 2016, which is the last full year they reported Method 1 GMV. As you can see, there is a huge variance between the two.
The difference between the two methods is explained in the footnote below.

As the boxes above explain, Method 1 excludes from GMV any orders over RMB 2k that are not ultimately sold or delivered. Method 2 raises this exclusion to RMB 100k, and also excludes buyers who spend more than RMB 1mn/day. The exclusion is ostensibly done in order to reduce fraudulent transactions, or what is known as “brushing”.
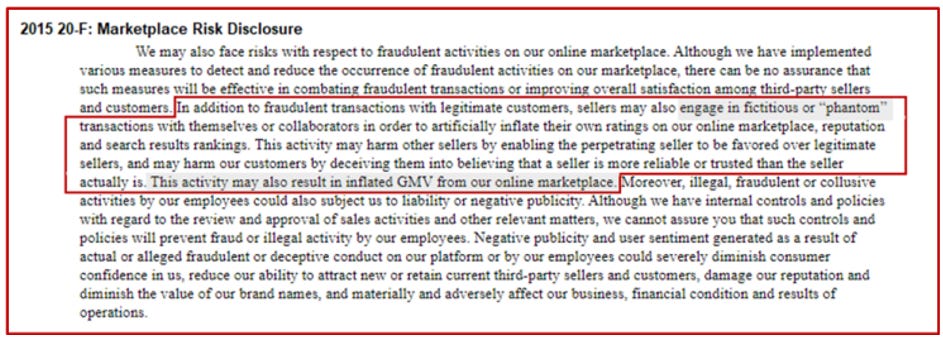
Brushing is the practice of creating fake purchase orders in the aim of moving your product up the search result page as well as having the opportunity to create fake positive reviews in order to entice other buyers to purchase your product. JD notes this in their risk disclosure below. Why RMB 2k was originally picked is not clear, but what is clear is that raising the limit increases the GMV shown by 43% in 2016.
We mentioned that JD historically was mostly a 1P seller. Since the nature of 1P is that JD is the seller of the goods, there isn’t an incentive at the company level to create “phantom” transactions. This is because JD doesn’t care which product you buy, just that you buy from them continually—and damaging consumer trust would likely lead to fewer returning customers. However, as 3P transactions grew to 43% in 2016, the difference in GMV Methods and (presumably brushing) increased.
Interestingly (and bizarrely) enough, they fully acknowledged the shortcomings of the new method they would move to on a 3Q17 earnings call.

While it was odd management acknowledged the futility of a metric they will continue to provide, we are thankful for the few years they disclosed both that allow us to glean some industry insights. (Allegedly, they discontinued the Method 1 GMV calculation because the press would constantly underreport their market share, since their methodology has a more onerous exclusion.)
The key is that $1 of new Method 2 GMV equates to 70 cents on the old Method 1 GMV. In other words, this accounting change increases GMV by ~40%, much of which may be brushing activity.
Alibaba’s Monetization Rate with New Context.
Now looking to Alibaba, we see that we don’t actually know what their exclusions were/are.
Alibaba’s definition of GMV doesn’t actually make clear if it is the same definition that JD now uses. In Alibaba’s definition of GMV (shared below), we see that they use similar language as JD and note they exclude certain product categories over a certain amount and buyers who spend a certain amount per day. But we don’t actually know what these limits are. Alibaba does say they try to eliminate the impact of fraudulent transactions, which seems like somewhat of a consolation, but it is sufficiently ambiguous that you can’t actually draw any conclusion from it. There is more limited information compared to JD’s disclosure, but it is possible they have a more nuanced system than a blanket RMB threshold.

Given that JD has a more stringent 3rd party seller screening process and harsher punishments for misbehavior, it’s not out of the realm of possibility that Alibaba’s Taobao and Tmall have similar, if not worse, levels of brushing activity.
The implication is that if Alibaba’s GMV includes significant brushing (which does not constitute a real economic transaction), their real Monetization Rate is higher.
Now, remember how we first estimated Alibaba’s Monetization Rate to be 4%?
In light of our new understanding of GMV, that is too low. If a more onerous GMV definition that would better eliminate brushing activity would reduce GMV by ~30%, that suggests a better Monetization Rate estimate is closer to ~6%.
If you take Alibaba’s $1.1tn in China Retail Marketplace GMV and assume the magnitude of the accounting adjustment is similar for them, that represents a $330bn difference in GMV.
However, JD provided further disclosures that give us even more insight.
Using JD’s 1P/3P Disclosures to Further Hone Our Estimate.
There is a second way that we can use JD’s disclosures to estimate how much GMV translates into revenues. For a short period of time, JD reported 1P revenues and 1P GMV (1P revenues are called Net Product Revenues).
Importantly, revenue has a more stringent definition than GMV. While in theory these two figures should have virtually been the same, there was a >50% difference between 1P GMV and 1P Revenues (RMB 372bn vs. RMB 237bn for 2016).
We look at 1P GMV vs 1P Revenues below. As you can see, 2016 1P GMV is RMB 372bn whereas reported 1P product revenue is RMB 238bn. Given this huge disparity of RMB 134bn, or 36% of GMV, we wanted to walk through the delta below to better gauge how much GMV activity has an economic basis.

We first start with Net Product Revenues of RMB 238bn (2016), and we gross it up for the VAT (value-added tax). This variable is relatively easily accounted for, as they note it ranges from 13-17% based on product category. Most merchandise appears to fall in the 17% category, so we assume a figure towards the high end at 16%. We take the reported Net Product Revenues and gross this up by the VAT to get the product amount including taxes.
The difference between this figure and their 1P GMV is a grab bag of different items. Remember, we are comparing 1P revenues to 1P GMV, and we are assuming that JD does not engage in brushing on their 1P transactions. This difference comes from (1) discounts that JD offers consumers, (2) orders that are returned, (3) placed orders that are later cancelled, and (4) other business taxes or fees, which we think is the least consequential factor.
As far as items 1-3 are concerned, it is hard to discern how to weigh them, but it is not uncommon to have a ~20% return rate. We use the calculated difference between “1P GMV” and “Net Product Revenue inc. Taxes” from the exhibit above to inform our analysis on the 3P marketplace take-rate below.
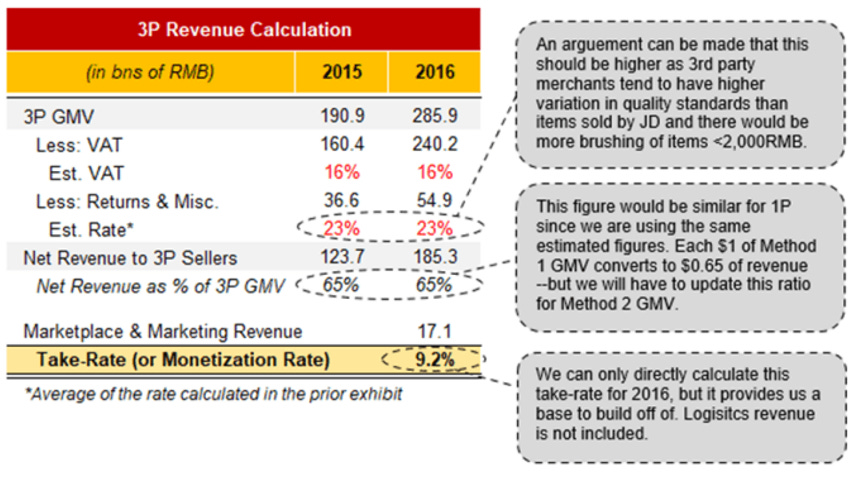
The analysis we ran in the prior exhibit allows us to estimate what 3rd party sellers net revenues are. We do this to see what actual portion of sellers revenues JD takes. If we calculate the Monetization Rate on 3P GMV, it is about ~6%. However, when running the math on our calculated 3P Seller’s revenues, it jumps to 9.2%. This means that the effective Monetization Rate, or “take-rate”, on real economic activity is about ~50% higher than the rough math would suggest. And this is before they move to a less onerous definition of GMV.
As we show below, we note that every $1 of “Method 1” GMV turns into an estimated 65 cents of revenue, which falls to 45 cents under “Method 2”. (Methodology will be explained shortly).
We call this ratio out because it will help make apparent how much the quality of GMV has deteriorated. Recall that the Method 1 definition only excludes transactions that are not completed above an arbitrary limit of RMB 2k (or ~$315). So to the extent there is brushing in JD’s marketplace of transactions under RMB 2k, then seller revenues would be less, and the take-rate would be higher.

In the exhibit above, we create two terms to help clarify our analysis: 1) Platform Revenue, which we define as total revenues generated from the underlying GMV, and is calculated by adding JD’s Net Product Revenues to the 3rd party revenue estimate we calculated above, and 2) Revenue Monetization Rate, which we define as Platform Revenues/GMV, shows how much revenue is generated for each dollar of reported GMV, and is designed so we can get a sense of the quality of GMV.
A 65% Revenue Monetization rate means that they turn every $1 of GMV into 65 cents of revenue, whereas a 45% Revenue Monetization Rate means that every $1 of GMV turns into 45 cents of GMV. (We are including total revenues to the 3P seller, not just the portion JD records, so we are avoiding the 1P/3P accounting distortions).
When comparing the same periods, a high Revenue Monetization Rate suggests that most of the GMV has a true economic nature vs. just being brushing, returns, cancels, taxes, or prices prior to discounts. As you can see, the rate deteriorated dramatically under the Method 2 accounting treatment to the point that not even half of each dollar of GMV translates to revenue for JD or a 3P merchant. Method 2 GMV is ~40% higher as a direct result of the accounting change and not because of any increase in real economic activity.
Implications for Alibaba and other Ecommerce Platforms.
To summarize, we started by showing Alibaba’s Monetization Rate was about 4%.
We then estimated it to be closer to ~6% since JD’s disclosures showed GMV being restated ~40% with the less restrictive definition.
Then, we showed that JD’s 3P take-rate as calculated on Method 1 3P GMV being ~6%, which increased to 9.2% when adjusting out estimated uneconomic GMV.
A directionally similar calculation to Alibaba’s Monetization Rate would suggest that the ~6% is increased to ~9%.
If an investor started their high-level analysis thinking the Monetization Rate was low for the ecommerce industry, perhaps after adjusting their figures for disclosures found in the footnotes, they would have change their mind.
An investor can make whatever assumptions they wish for their own estimates, but now they directionally understand that the GMV figure is more up for interpretation than most appreciate.
Thank you for reading. Follow us on Twitter @Speedwell_LLC for more business content or if you any questions!
If you’d like to read our full company reports, subscribe to Speedwell Research.

*This is not an investment recommendation. The purpose of this piece is simply to try to help an investor improve their business analysis skillset whilst using publicly available information. We make certain assumptions in our analysis that may be wrong. You may find our full disclaimers here. Please reach out to us if you believe there are any errors in this piece.
Most would think that with the data these platforms collect, they would be able to accurately report one of the most important metrics for their business. Thanks for the post!