Meta 2Q23 Earnings Recap
Speedwell Research: Business Updates Series
We are going to periodically share updates on companies we have covered in the past here. These will sometimes show up as Twitter threads first, but we want readers to be able to easily access the archive of earnings recaps. The start here tab allows for easy navigation. We may occasionally refine or expand our analysis based on feedback.
This week, we’re covering Meta. Previously, we’ve covered Coupang, RH and Constellation Software.
Meta just reported 2Q23 and the the stock is up +7% after hours, putting YTD gains over 150% This quarter is a strong indication that Meta has hit an inflection point in key areas.
Starting with usage, Daily Active People (Family of App users) grew 50mn q/q to 3.07bn (+7% y/y). Monthly Active People grew +70mn q/q to 3.03bn (+6% y/y). And despite “irrelevance”, Facebook is still growing users: DAUs +27mn q/q (+5% y/y) and MAUs +41mn (+3% y/y).
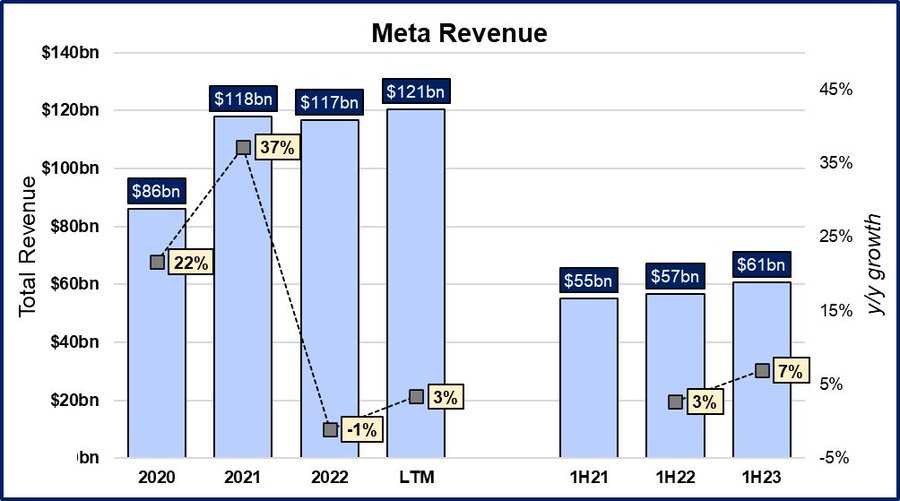
Total 2Q23 revenues were +11% y/y at $32bn, which was right at the high end of their guidance range of $29.5-32bn. FX impact is ameliorating, representing just a -1% headwind versus -3% last Q. Family of Apps revenues +12% y/y at $31.7bn, accelerated +800bps y/y from 1Q23.
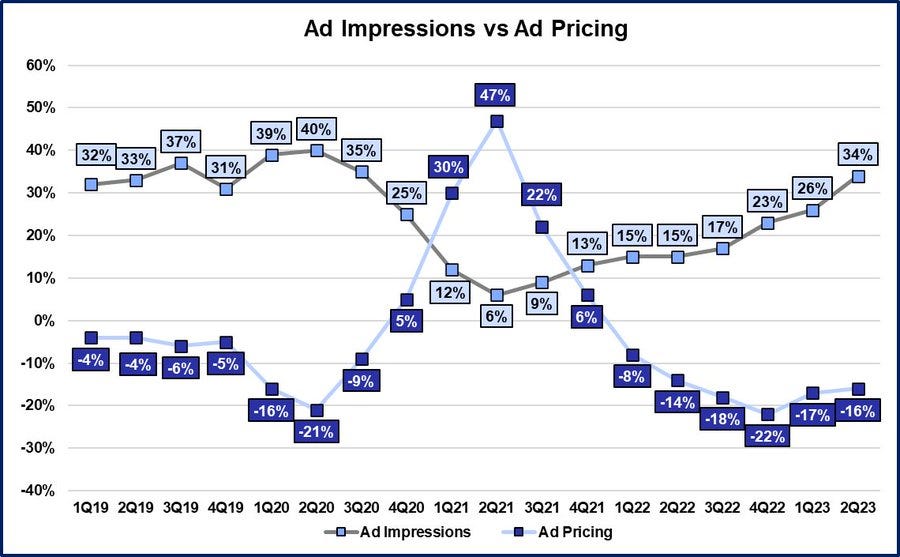
Revenue was driven by a mix of user gains, time spent, and ad load increases, offset by lower ad prices. Ad impressions were +34% y/y whereas ad pricing decreased 16% y/y. This marks the sixth quarter of ad pricing decreases and the strongest impression growth since 3Q20.
For the first quarter in a while, expense growth (+10% y/y) is less than revenue growth. Total consolidated operating margins of 29% were +420bps sequentially. (For context op. margins were 40% in 2021 and 25% in 2022).
Just focusing on Family of Apps, operating income margins expanded q/q +180bps to 41%, but still lags far behind 2020 and 2021 FOA margins of 46% and 49%, respectively. Going forward, more moderate expense growth coupled with an acceleration of revenue growth could drive progress here.
Reality Labs losses expanded 33% y/y to $3.7bn, but are down -$250mn q/q. They are guiding for RL losses to expand y/y from 2022’s loss of $13.7bn. They are on pace to lose about $15bn in this unit, in line with prior expectations.
For next quarter, 3Q23, they are guiding revenues to $32-34.5bn. This represents 15%-24% y/y growth or 12-21% excluding the expected 3 point FX tailwind. This is an FX-adjusted flat to +900bps expected acceleration in revenue growth sequentially.
Meta increased expense guidance for the full year to $88-91bn (from $86-90bn), which implies 0-4% annual expense growth y/y. This is inclusive of a $4bn restructuring charge and severance, as well as RL losses. We should see more operating leverage in the back half of ‘23.
Full year capex guidance was lowered to $27-30bn, down from $30-33bn. However, they expect higher infrastructure cost next year. FCF conversion (excluding SBC) comes in at 82% for 1H23, which is an improvement from recent years.
Some notables from the call include recommended content in the Facebook Feed, which drove a +7% increase in time spent.
Reels continued to be a success, reaching 200 billion plays per day. Reels is now monetizing at a ~$10bn run-rate, up from $3bn just last fall. (Likely responsible for many of those new impressions.)
On Threads, Zuckerberg emphasized it is too early to talk monetization and their focus is on improving features and retention. He also spoke on how it was built by a small team, showing how the year of efficiency is driving cost savings and productivity.
On ad targeting they noted continued progress with Meta Advantage. This was key in helping Meta stitch together the lost signal from ATT and improve targeting and attribution. (Listeners of our new podcast will recall our discussion on this - Spotify Here, Apple Here).
They also talked about progress with their new AI ad model announced last May–Meta Lattice.
Management also spoke about using “AI Sandbox” for generative AI tools to help advertisers create ad copy. This can help improve ad quality and thus click through rates.
Overall, this was a very strong quarter and suggested that Meta is well past the ATT hiccup. Usage no longer seems to be a worry and we didn’t hear TikTok mentioned once. That Capex build to power new AI tools also wasn’t questioned like previously.
While we prefer our reverse DCF, which allows us to see what the return is under various assumptions, we will provide a simple valuation framework. LTM revenues are ~$120bn, with virtually all of that coming from FOA.
LTM EBIT was $29bn, which jumps to $44bn excluding the RL losses. We think it makes the most sense to just look at FOA first. FOA used to run at near 50% margins, but LTM is 37% (2Q23 was 41%).
If you expect more operating leverage in the near term as revenue growth accelerates with a more moderate expense pace, then >45% EBIT margins seem plausible. With a 45% margin on LTM FOA revenues, EBIT is about $54bn. Taxing at 21% gets us ~$43bn.
Today’s after the close market cap is ~$810bn. Add back 5 years of $15bn RL losses (technically should PV) and adjust for cash you’ll get an adjusted EV of $865bn. The implied multiple on their underlying FOA earnings power is 20x (assumes RL is worthless).
If you believe they can continue to grow double digits, you likely find this attractive. Frankly though, we believe a reverse DCF is a much better way to understand what “multiple” to place on a company.
If you liked this thread, then check out our new podcast where we dive deep into Meta and cover everything from the ad tech landscape to the history of network effects (Spotify Here, Apple Here). We will cover many other businesses in the future.
And if you want to learn more about our reverse DCF and valuation methodology, consider becoming a member today to gain access to the full 47,000 word report.
If you liked this post, please share it so we know to post more content like this. Follow us on Twitter @Speedwell_LLC or Threads @speedwellresearch for more business and investing content!


