Priced to Outperform Perfection: The Home Depot Circa 1999
Memos on Investing: Looking at Home Depot's 2003 store goals from an investor's perspective in 1999
Welcome to Speedwell Research’s Newsletter. We write about business and investing. Our paid research product can be found at SpeedwellResearch.com. You can learn more about us here.
There is a podcast of this memo available if you prefer listening to it. You can find it on our podcast feed here (Apple, Spotify).
One of the most common risks with a successful business is simple: how large can it get before it saturates the market? This is a key question for investors who may be counting on many more years of growth in order for the company to generate enough earnings to rationalize a higher valuation. The problem typically stems more from lofty investor expectations rather than the company misunderstanding the market potential, but of course, either can happen.
Take Home Depot for example. In January 2000 (fiscal 1999) they had 930 stores. However, they were targeting over 1,900 stores by January 2004 (fiscal 2003). This is a more than doubling of the store base in 4 years.
For the fiscal year ending 1999, they generated $38.4bn in revenues and opened 160 new stores.
Rather than asking the question immediately whether 1,900 stores is too many, a conservative investor could start by inverting the problem. Instead of starting the question with the risk of not achieving 1,900 stores, start with the return of what you’d get if they did.
While this may seem contradictory to Warren Buffett’s “two rules of investing” (rule #1: don’t lose money, and rule #2: don’t forget rule #1), it is not because every investment must have a sufficient return to justify the inherent risk. We simply want to gauge what the return is first so we can better contextualize the potential acceptability of the risk. A high prospective return and a margin of safety are mathematically the same thing (we will expand on this idea more in a future piece if there is interest), so in gauging the potential return we are effectively seeing how much margin of safety there is in the 1,900 store assumption.
Thus, should we see a very high return for a 1,900 store assumption, we can then see how much we can cut it and still receive an adequate return. This is the equivalent of building a margin of safety.
Separating High Growth from Steady-State Economics
In theory, we want to figure out how much an average mature store makes and then multiply that by total store count. This would allow us to apply a conservative steady-state multiple on the earnings instead of a “guessing” of how much growth a higher multiple implies.
For instance, if you value a company at 35x, you would need 9 years of 20% growth in order to get a 10% return (assumes business is valued at a market multiple after the high growth period ends). We ideally want to explicitly model the high growth period, rather than have the growth implicit in a higher multiple. (If this isn’t clear, we will go into more detail on this in a future piece).
However, a few things complicate getting “mature” revenues per store. Typically, with retail stores, there is a sales ramp-up period after the store opens. This is because not everyone knows about the new store. But the longer it is open, the more people learn about it and incorporate shopping there into their routine.
As far as we can find from a cursory look, they did not disclose an average mature store revenue figure in 1999, so we will estimate it. Just taking a straight average revenue per store gets us $41mn. However, many of the 160 new stores were not open the whole year. Additionally, many stores are newer and still “ramping” up. However, offsetting that is the fact that new stores could moderately cannibalize existing stores. Assuming the new stores were only open for half the year, we get $45mn per store.
This $45mn figure is an imprecise “mature” revenue per store estimate based off what we knew in 1999. If they hit there 1,900 store ambition in 2003, we wouldn’t expect the stores to be making that yet, as they would take a few more years for newer stores to reach maturity.
Home Depot “Ante Facto” Napkin Math.
Assume they hit 1,900 stores. About 20% of those stores, or about 320 of the stores, would have been added in fiscal 2003. So at the beginning of the year, they would have about 1,580 stores, about a third of which would have opened just a couple years ago.
For rough math, let’s assume 1,500 stores earn close to the $45mn above, and the rest earn about $35mn. We then assume the new stores that opened in 2003 were open for just half the year. This gets us about $71bn in revenues.1
For fiscal 1999, the operating margin was 9.9% with 0.3% pre-opening expenses. We may have thought in 1999 that they would show more operating leverage as they mature, but we would likely still take the 10% operating margin figure.2
Now, our revenue build is simply $71bn x 10% and then taxed at 35% (1999 statutory rate). This yields us roughly $4.6bn in earnings.
The multiple an investor applies at this point will be dictated by their opinion on Home Depot’s growth after they reach 1,900 stores.3 Perhaps stores can service more business than they currently do, and they have an opportunity to add new product lines. Pushing more sales through the same store footprint could increase operating margins. A conservative investor is likely to settle somewhere around 15-20x, and an investor who really believes this model has much more potential may pay 25-35x. (Full discussion on the “right” multiple to use to come).
This gives us a conservative valuation of $70-90bn, with the “believer” thinking it is worth $115-160bn.
The market cap at the time (January 2000) was $128bn.
Maybe this made sense though. They did mention e-commerce several times in their annual report …
Jokes aside, that meant an investor would need to believe they had a strong growth trajectory even after 2003 in order to make a return.
Perhaps an investor thinks they can grow store units 20% a year for a decade instead of just 4 years. Regardless of whatever assumptions they believe are reasonable, what is clear from this analysis is that just hitting Home Depot’s target of 1,900 stores in not likely to generate an adequate return. They must still have strong growth thereafter.
Now, we see the original question has changed from “How comfortable are you assuming Home Depot will grow their store count to 1,900 units in 4 years?” to “How comfortable are you paying today for their store count to grow to 1,900?”
By bringing the prospective return into the equation, it makes clear you are paying for that growth today, and any investor return would require increasing your assumptions beyond the 1,900 stores/ $45mn per store assumptions.
Counter Factual World.
Before going into what actually happened, let’s assume that Home Depot beat this 1,900 store target and hit 2,000 stores. Then they outperformed our revenue estimates by 10% and even managed to improve operating margins to 13%. In such an incredible scenario, they would generate about $6.5bn in earnings.
At a 25x multiple, which itself assumes more growth is to come, they would be valued at $160bn. An investor would earn about a 6% annual return from stock appreciation. With some dividends or stock repurchases, perhaps that could get close to 9-10%, which is about what the stock market returned historically.
Would you feel that this investor was properly compensated in this counter factual world?
What Actually Happened.
In 2003, Home Depot operated a total of 1,707 stores, failing to hit their 1,900 target. Interestingly, they noted that new stores “cannibalized approximately 17% of existing stores and… reduced fiscal 2003 comparable store sales by 2.7%”. They later noted that they have 11% market share and expect 4-6% same store sales growth for 2004. This commentary both shows the downside of adding more store units in an existing market (cannibalization) but also that it is generally short lived with the company returning to growth thereafter.
Its total revenues were $64.8bn, about ~8% off our rough calculation which assumed 1,900 units.
The simple average revenue per store was $38mn (versus our unadjusted figure of $37.3mn. Calculated as $71bn/1,900 units).
Net earnings were $4.3bn (includes a 200bps higher tax rate) vs our estimate of $4.6bn.
Now, the 1,900 store target may have seemed ambitious in 1999, but we think our estimates which assumed they achieved that target were directionally accurate.
What you want to do as an investor is find a price you could have paid where Home Depot could have missed their ambitious target of 1,900 units and you could have still made money.
Instead, at a $128bn market cap, they weren’t just priced to perfection, but priced to outperform perfection.
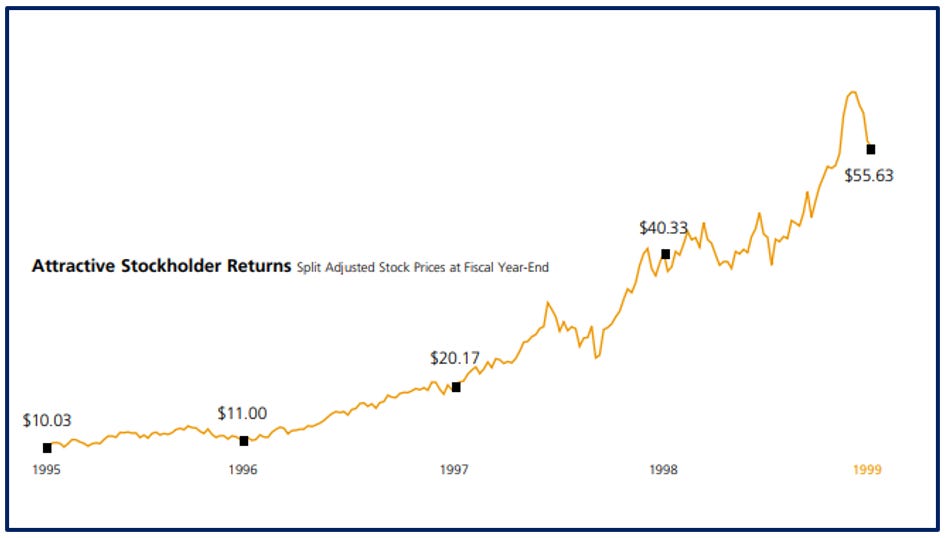
Unsurprisingly, Home Depot removed the up-and-to-the-right stock price chart they proudly displayed in Fiscal 2000. Their stock was given a significant haircut from $55 to a low of $20 at the end of 2002.
At a $37 share price, the market values them at $86bn, or about 20x earnings.
Those curious can run math similar to what we ran above for 2000 to see what assumptions they would need to make in order to get an adequate return at this point in Home Depot’s history.
We’ll give you a hint though: the lower multiple means your assumptions can be much more conservative.
Buy a Great Company at Any Price?
Lately, the idea that you can buy a great company to hold forever and the price doesn’t matter has seemed to gain some traction. We will address this more in a different piece, but consider this: the difference between buying Home Depot when it was at 50x earnings at the end of 1999 versus buying it at the end of 2003 at 20x was the difference between a 9% return and a 13% return.4 While a 9% return before dividends isn’t bad, this line of thinking is missing a key point… Which purchase was less risky?
We will write much more about many of these topics more in the future. Please comment though if you have any questions or want us to write more about a topic.
Check out our new podcast, The Synopsis, on Apple and Spotify and follow us on Twitter @Speedwell_LLC!
In theory, we should apply mature store revenues of $45mn to the full 1,900 stores and then discount back by a longer period. We thought this method would be a little simpler to understand though as the revenue estimate would be more in the vicinity of what we’d actually expect HD to generate in Fiscal 2003 (rather than a theoretical number of revenues assuming new store cohorts were mature).
Following from the above footnote, if we choose to use mature store revenues then we should also use a mature company margin.
Ideally we would explicitly model out the high growth period and then apply a “steady-state” multiple.
This figure is before dividends.


Really enjoyed this one.