Balancing Risk and Return: The Simple Statistics of Investing
What Buffett's Two Rules of Investing Mean in Probabilistic Terms
Welcome to Speedwell Research’s Newsletter. We write about business and investing. Our paid research product can be found at SpeedwellResearch.com. You can learn more about us here.
There is a podcast of this memo available if you prefer listening to it. You can find it on our podcast feed here (Apple, Spotify).
If you are new to Speedwell Memos, welcome! We have pieces on Zara & Shein, Google’s AI risk, Why Wish Failed, Alibaba’s Accounting, What was priced into Home Depot in 1999, as well as many others! Also, if you haven’t already, check out our business philosophy pieces on The Piton Network (Part 1 and Part 2), as well as our Series on The Consumer Hierarchy of Preferences. A directory of our memos can be found here.
The Statistics of Investing.
More harm has been done to investors by this graph than any other single depiction. The flawed implication is that taking on more risk can reliably generate higher return. Of course, though, if this was true then taking on more “risk” wouldn’t actually be riskier.
A much better illustration was popularized by Howard Marks; here we see risk being depicted as a probabilistic distribution. This graph shows that the more risk you take on, the wider the distribution of outcomes—some with higher returns, some with lower returns.
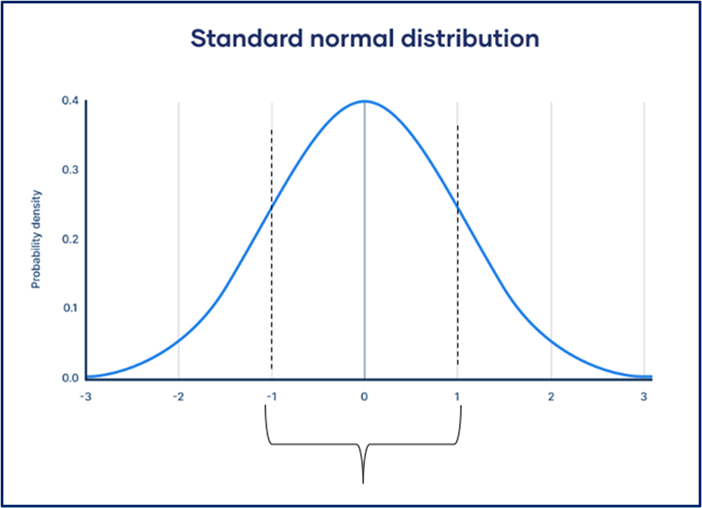
A simple probabilistic distribution is shown below.
The numbers at the bottom are “standard deviation”.
The line right down the middle is the “average” or “mean”
The standard deviation measures how far outcomes are from the mean.
Generally, the more “risk” in an investment, the more disparate the outcomes.
A standard deviation of 1 includes the area of the probability distribution below.
For what are called “normal distributions”, 1 standard deviation includes 68% of potential outcomes.
2 standard deviations include 95% of potential outcomes.
3 standard deviations is 98%.
Now let’s add some numbers to the chart.
The mean is 5%. The return band within 1 standard deviation is 0 - 10%.
That means in 68% of outcomes you will earn a return somewhere between 0% and 10%.
Looking at 2 standard deviation outcomes, the return band is -5% to +15%.
That means you have a 95% chance of making or losing somewhere in between -5% and +15%.
As an investor, you want to look for investments where you make an adequate return in the vast majority of outcomes.
Investments can have different risk profiles than a normal distribution.
Below we see a “left tail” or “negative” probabilistic distribution.
If an investment has this probability distribution, then that means most outcomes return a positive amount with a very low possibility of loss. Warren Buffett essentially only invests when the scenarios where he loses money are very remote.
We all know that Buffett has said there are only two rules in investing. 1) Do not lose money. 2) Do not forget rule #1.
What does this actually mean in practice though?
Look at the distribution above and pay attention to the area under the curve. The area under the curve corresponds the the probability that an event happens. If that dotted line represents a 0% return, then you can see the area to the left is very tiny compared to the area to the right. That means in the vast majority of cases this investment will generate a positive return.
While Buffett will never put it in these statistical terms when investing, he alludes to his thinking when he talks about CAT insurance. He would note that they are okay taking certain 3 standard deviation risks because you are still probabilistically likely to make money. He makes this point again when talking about his $1 billion dollar March Madness bet where there is a 1 in a 9.2 quintillion chance of a perfect bracket where they’d have to pay it out.
As an investor, it is your job to find opportunities where you deem the probabilistic return to be satisfactory and the potential downside to be remote enough to be acceptable.
To paraphrase Seth Klarman on Buffett’s Two Rules comment, “the aim isn’t that you will never lose money, but rather that your portfolio will never lose money”
Now this can all feel hypothetical, but how can we practically implement this?
Enter the Reverse DCF.
The Reverse DCF allows us to not only size up what the return profile of a company is, but also makes risk parameters more explicit so we can try to estimate risks. When we sensitize around specific variables to get different outputs, we are effectively trying to shape a probability curve in our minds in order to better understand the risk/reward.
Perhaps your reverse DCF shows that a fairly draconian scenario of low growth and margin compression still leads to a return above the risk-free rate, which while not fantastic, is certainly not bad if that is the worst plausible outcome.
Your conservative base case scenario may show a good return, with less likely, but still possible outcomes of much higher returns. The reverse DCF is allowing you to directly tie risk (different scenario assumptions) to returns (the reverse DCF output).
The table below is an illustration of how we can use a reverse DCF. In this DCF we sensitized for 5 revenue growth and 5 margin scenarios, creating 25 outputs. The way it works mechanically, is after you change your DCF assumptions, you solve for the discount rate that makes the value of the DCF equivalent to the current market price. This then tells you what prospective return you would receive under the given assumptions.
Keep in mind though that this output is a super long-term return that assumes all excess cash is returned to the investor. If the business reinvests excess cash at a value destructive rate of return, or simply lets cash pile up on the balance sheet indefinitely, your return would drop.
The simplest way to explain this return figure is that it would be your return if you owned the entire business and at the end of each year, you distributed all excess cash to yourself.
We can see that even in the awful revenue growth and margin scenario the business is still expected to return 4.2%, roughly where the 10 year is today. If the worst plausible downside scenario is you still make a return around the risk free rate, then that may not be considered bad, since there is little “risk” in assuming the worst outcome happens. Of course, you could be wrong about what is a likely worst case outcome.
We highlighted the “meh” to “decent” outcomes as that is likely where a conservative investor will hone in on. If you are getting near historical stock market returns (or the commonly used hurdle rate of 10%) on fairly unassuming assumptions then that could be considered a potential investment. Of course, each investor will have their own investment hurdle rates and will make their own judgement on what they consider to be a fair return for the risk they perceive.
Lastly, the reverse DCF typically only values existing and more mature businesses. Many businesses may have upside in the form of new markets or new lines of business that are not explicitly accounted for in the DCF. The more an investor “believes” these will materialize, even if they can’t quantify it today, the more they may be willing to accept a lower return on base case assumptions.
The Reverse DCF works best when an investor has some semblance of what assumption ranges to place, however in a large variety of investments, particularly early stage companies, no such range can comfortably be placed. With these investments another strategy must be employed.
We followed up this memo by tying it to different investing strategies and portfolio management. Read it here!
The Synopsis Podcast.
Follow our Podcast below. We have four episode formats: “company” episodes that breakdown in-depth each business we write a report on, “dialogue” episodes that cover various business and investing topics, “article” episodes where we read our weekly memos, and “interviews”.
Speedwell Research Reports.
Become a Speedwell Research Member to receive all of our in-depth research reports, shorter exploratory reports, updates, and Members Plus also receive Excels.
(Many members have gotten their memberships expensed. If you need us to talk with your compliance department to become an approved vendor, please reach out at info@speedwellresearch.com).


