The Future of Ecommerce That Wasn’t: An In-depth Look into What Went Wrong with Wish
What an Investor Could Have Learned From Wish's S-1
Welcome to Speedwell Research’s Newsletter. We write about business and investing. Our paid research product can be found at SpeedwellResearch.com. You can learn more about us here.
There is a podcast of this memo available if you prefer listening to it. You can find it on our podcast feed here (Apple, Spotify).
The Set Up.
2020 is drawing to a close.
The QQQ is up over 75% from its lows.
Bitcoin is up over 400%.
David Portnoy has traded in his sports commentary for stock commentary.
And the idea that work from home would create “Covid Beneficiaries” wasn’t even hackneyed yet.
This was the backdrop in which investors were introduced to the “next” ecommerce winner.
Pitching Wish.
It was magnificent. A new way to surface items. A demand generator. A low-cost way for merchants to not only sell their products, but also be found in the first place.
Whereas Amazon was great when you knew what items you wanted to buy and could deliver them to you rapidly, Wish was serving an entirely different market.
Wish was about discovery, deals, and novelty, but also data and a sophisticated algorithm that would know what consumers wanted before they did. Tiktok excelled in recommending videos and could keep you glued to your screen for hours; Wish would do the same for product merchandise.
As Amazon continued to load their app with more and more sponsored ads, it was harder for merchants to stand out without paying for that top search slot. And besides, Amazon ads only worked when the user was searching for relevant keywords.
Wish would not only show users products they wanted to buy, but they would also help physical stores with merchandise procurement. Wish would help small businesses stock their stores by leveraging their millions of data points and direct wholesaler connections to tell the small store owner what products to order and when. Even better, Wish buyers could pick up their packages in-store and see a display shelf with Wish-stocked inventory to impulsively purchase.
And the best part about all of this is that Wish wouldn’t be directly competing with any existing companies. They would be focusing on an area of commerce that is commonly overlooked.

If you know what happens next, try to forget it. For this exercise we want to rely only on information an investor would have known at the time before things went wrong. We will rely primarily on the S-1 and to a much smaller extent (and for ease of comparison) the 2020 10-K.1
How to Not Draw the Wrong Lessons.
A good explanation is a story that is hard to vary.2 If we did a postmortem of WebVan (grocery delivery) or Pets.com (online specialty store for Pets), what would we say went wrong? If we did the postmortem in 2006, most likely we would have said it was a silly and unrealistic idea. But if we were to do a postmortem now, with the existence of Instacart (grocery delivery) and Chewy (online specialty store for pets), how would our understanding change?
This is not a trivial exercise. It is far too easy to be dismissive about a failing business and think it was the entrepreneur’s ill-thought-out idea or just incompetence, but this does not hold scrutiny.
Look at Apple. For how many years was Steve Jobs and his insistence on not licensing the Mac operating system seen as the impetus for their failure? And the same thing happened again when the iPhone was released: analysts thought their unwillingness to license the phone’s iOS would ultimately lead to their demise. Now though, Apple’s success is attributed to their close integration and their proprietary software is a key selling point, which wouldn’t be possible if they licensed it.
If you took over Lego in 2004 when it was nearing bankruptcy, what would you diagnose as the problem? Would you have thought that with digital entertainment kids just don’t want to play with toy blocks anymore? Or would you have thought the focus on “noncore” activities like theme parks, clothing, and video game development were the issues? Perhaps the product was good but was simply too expensive? You know that today there are vastly more digital entertainment options than there were in 2004, they still have theme parks and video games, and their products are still expensive, so what was it?
If you were appointed CEO of Crocs in 2008 when their stock dropped 98% and was on the verge of entering bankruptcy, tell us that you wouldn’t be tempted to lay the blame on the aesthetics of the shoes. It is the most ridiculed shoe design with “ugly” virtually synonymous with Crocs and yet they now sell over 150 million of them a year. Again, what some people would identify as the problem of the business turned out to be a virtue.
This is why counterfactuals, or what would still be true under different circumstances, are so important. Turnaround stories are great because they provide their own counterfactuals. When looking at Wish, we will try to dispute reasons for failure that have seemed to not be the culprit for other successful companies.
As we noted at the beginning of this section, a good explanation is a story that is hard to vary. What that means is we shouldn’t be able to change facts of the story and still get the same outcome. So, if we are saying Wish was unsuccessful because of their focus on cheap items with slow shipping, we shouldn’t be able to point to another company that did something similar and was successful.
Let’s begin.
Wish (Ex-Post Facto) Premortem Analysis.
One of the more commonly cited reasons for Wish’s failure is how much they spend on Sales and Market (or S&M). This is only half correct though.
Look at the chart below that shows S&M as a % of revenue. One company would go on to be a dominant ecommerce platform that posted over $2bn in operating profit in its most recent quarter. The other would do a 30 for 1 reverse stock split to avoid being delisted as a penny stock.
Note that both companies spent almost all of their revenues on advertising and would incur notable losses to sustain that. How much money they spent on advertising wasn’t the problem, despite how often that was cited as an issue.
The issue was how ineffective the advertising was.
Now we can adjust revenues to backout logistics revenue for one company, which S&M does not really support. For fairness, we adjust 1P sales for the other company. (See this piece for an explanation of how 1P and 3P sales can skew economic reality).
We see the story changes with these adjustments to revenues. Whereas both companies spent almost all of their revenues on marketing in 2018, by 2020 Company 1 reduced their spend by 26 percentage points, whereas Company 2 reduced their spend by just 8 points.
This is called marketing leverage. In theory, as a company scales, their revenues grow. And while they may keep the total dollars spent on marketing high, in percentage terms it falls as revenues grow more than their marketing budget does.
In theory, there are two kinds of marketing, just like with capex: 1) growth marketing, and 2) maintenance marketing. Growth marketing would be marketing designed to acquire new customers and make incremental sales. Maintenance marketing is designed to keep users you already have. If you ever got a “$5 off your next DoorDash” or “20% of your next three Lyfts”, then you have been the beneficiary of maintenance marketing. These companies may have earned you as a customer in the past, but they need to keep reengaging with you in order for you to stay. Their hope is that eventually you will build a habit with them, and they will not need to offer you any more promos to stay a customer.
We can do a rough test to gauge S&M efficiency. In the graph below, we take incremental revenues and divide it by the total marketing budget for each year. While this metric isn’t perfect, it will allow us to get a rough idea of marketing efficiency. (Others may prefer to use gross profits, but the output is similar).
While this test cannot tell us whether they are acquiring a new user to replace the one that churned, or if they are reengaging an existing user to stay, it still gives us a good sense of how much marketing is needed to keep their existing revenues.
What we see above is that in 2020, Company 1 would earn 58 cents of revenue per dollar of S&M spent whereas Company 2 would earn 15 cents. In the year before the pandemic, Company 2 was earning just 3 cents of revenue growth per dollar they spent on marketing. What this suggests is that most marketing was spent just to replace users that left or reengage existing users to purchase again. If Company 2 cut marketing, then revenues would disappear. We cannot draw from the available info whether Company 1 is spending money well or not. That would depend on their gross margins and how long the customer stays around. If they make 58 cents in revenue for spending a dollar in marketing, they could eventually make it back if that buyer buys every year for about 2 years.3
If you haven’t guessed by now, Company 2 is Wish. Company 1 is Pinduoduo, the Chinese ecommerce company that displaced Alibaba in terms of most active buyers, and now also has a higher market cap.
Before moving back to our Wish analysis, we will say a bit more about Pinduoduo and other ecommerce players, and in the process, address three other common reasons Wish is thought to have failed: 1) their products were cheap tchotchkesthat had no market and 2) their shipping was too slow, and 3) fake listings.
The Wish That Was: Pinduoduo
In China, Pinduoduo pioneered the business model of community group buying, which was essentially purchasing products at steep discounts so long as enough people shared the item that the merchant reached some predefined figure of sales. For example, get a 140 Yuan air fryer so long as 100 people commit to buy it. The need for a deal to “tip” created a novel user acquisition engine as those yearning for cheap air fryers lobbied friends to join the deal4. Additionally, the model originally relied on group leaders who would arrange the last mile pick up of items: a group leader would start a deal, get a bunch of friends to join the deal, and then all of the items would be shipped to them. While this may seem odd, it makes more sense in the context of how Pinduoduo originally gained traction: through fruit sales. Essentially, Pinduoduo helped aggregate enough buyers that a farm could rationalize delivering a single order and still make money given the low value of most produce. While in short order they moved towards a more traditional delivery experience, it was only after they gained scale.
There are three key aspects that are different to note here: the first is their direct relations with farms, or manufacturers, the second is their logistics solutions, and the third is their customer acquisition engine.
Let’s start with the first aspect. The direct manufacturer relationship allowed them to keep costs low and cut out the distributors’ mark-ups. Wish would essentially do the same thing. In the blog post below, they note that it’s their direct manufacturer relationship that makes their products so cheap. We also see that Shein, the fast fashion clothing retailer, does something similar.
This is an important point because another criticism Wish gets is that they failed because their site is full of cheap, low-quality tchotchkes that had no purpose beyond short-lived novelty. However, Pinduoduo had success selling a lot of the same. Their international version of the app, Temu, has also gained enough traction that we can say there clearly is demand for these sorts of goods. Furthermore, Shein followed suit and added a lot more general merchandise to their site. In fact, some are now attributing Temu as the reason Wish cannot turnaround the company.
The second criticism that Wish gets is that their shipping was too slow. Wish’s thinking was that a consumer would be willing to wait a longer amount of time to save money. While they had other shipping issues which did seem problematic (items not arriving), the wait itself was not necessarily a problem. We see with Etsy that people are willing to wait usually at least a week, or much longer, for an item they really want. With Pinduoduo, we see people are willing to suffer some inconvenience to save money. Shein has 2 to 8 day waits and Temu has 6 to 20. So, it seems unlikely Wish’s 1 to 4 week shipping times was enough of an issue to kill them.
The third reason, as shown in this New York Times Article, was fake and misleading product listings. The NYT even notes employees created a store called “bestdeeal9” with “unbelievable bargains” like a $2,700 TV selling for a $1 to track how often customers complained when the item never came. The NYT states that:
Deceptive experiments like “bestdeeal9” drove customers away, as did low product standards and unreliable shipping. When the rising cost of ads forced it to scale back its marketing, the company struggled to attract new shoppers.
– New York Times, “How Wish Built (and Fumbled) a Dollar Store for the Internet.”
We would disagree with this assertion though, because customers never had high expectations on the app to begin with. Many reviews talk about how Wish is “hit or miss”, but that doesn’t entirely bother them, as it is very cheap and they can sometimes find great deals. The “unreliable shipping” also didn’t seem to be the issue, as long as the item eventually got there. Buyers talk about how they would often forget what they ordered anyway, and would be pleasantly surprised when they got a “gift” from themselves. The rising ad costs inherently has nothing to do with retaining users, but just acquiring new ones—they wouldn’t need to replace all of their users in the first place if there wasn’t a problem. (Look no further than Etsy, who recently complained about high ad costs, although that didn’t cause them to lose users).
To be honest, there is no clear singular issue you can point to in theory that would have predicted their demise. Almost everything someone could come up with could describe a different marketplace at a different point in time. eBay was fraught with scams when they first launched and Amazon had (and perhaps has) plenty of dangerous, cheap merchandise. Temu sells the same stuff as Wish, and with the same potential for it to show up a month later. Every 3rd party marketplace has had to deal with fake listings.
There is no one proximate reason why Wish turned out the way it did, and there is nothing in the business plan that in principle doomed them to fail. We will say a few more words on this later, but what is absolutely clear is that despite whatever narrative you want to attribute to their downfall, the numbers clearly anticipated it.
Wish Customer Churn Analysis.
All of the analysis below is from disclosures available in the S-1.
The chart below shows that LTM revenues from new buyers is 31% versus existing buyers at 69%.
Also in the S-1 they note that they have achieved a “buyer acquisition cost” or BAC of under two years. They define BAC as all digital marketing spend directed at app downloads divided by all new users in a period. So, note that other marketing spend, like brand marketing, is not included.
What we want to do is use these two facts to try to figure out how much marketing spend is spent on existing buyers. In theory, if existing buyers require promotions to purchase again (which is included in marketing spend), then they effectively need to be re-acquired in order to become buyers again. This is problematic if the promotion spend that Wish must incur on existing customers is so high that they can never make a profit from their customers.
The first analysis we run shows that we can use the facts above to estimate there is over $600mn in marketing left after acquiring their new users. While some of this was spent on brand marketing, like their large deal with the Los Angeles Lakers, even that was estimated to just cost $12-14mn annually. While in the analysis below we take the full $629mn as a % of sales, even a fraction of that would suggest their core ecommerce platform would never be profitable without meaningful changes.
For context, other 3P marketplaces like eBay have about 20% operating margins and Alibaba’s Core Commerce segment in 2020 was 32%. If we consider these platforms as optimistically what Wish’s aspirational margin profile could look like, then we see that spending anywhere near the 47% figure above would quickly consume their entire margin.
And we can confirm in the S-1 that their marketing plans do include re-engaging customers with deeply discounted promotions. The two disclosures below are from pages 90 and 134.

We will do one final analysis to estimate churn before concluding. However, we want to note that this analysis is unnecessary to make the point we are about to. If you simply saw that they lost users despite spending >80% of revenues on marketing, or almost ~$1.5bn, is there any explanation you would accept that could convince you the business was healthy? Imagine your Chief Marketing Officer just told you they spent $1.5bn to lose 2mn buyers and grow revenues 2%. How would anyone possibly see that as a good thing? And yet, with a little bump in numbers from Covid in 2020, it was overlooked by investors in favor of the hope of buying the next Amazon at IPO.
In the S-1 they disclose the following LTV chart. They calculate “LTV” as cumulative gross profits over a period of time attributable to new buyers acquired in a given cohort, divided by total new buyers, which is most certainly not what an LTV really is.
For example, let’s say a cohort generated $15 of gross profit in year one and then another $10 of gross profit in year two. They would add those two numbers up and say the “LTV” of the customer in year 2 is $25. Therefore, if you wanted to calculate how much each cohort generated in gross profits in a given year, you just have to take the difference between each year. In this example, this cohort generated $10 in gross profits in the second year versus $15 in the first year, suggesting ample churn. What you would want to see is each year’s incremental figure stay steady or increase.
The chart above shows cumulative gross profit by cohort. If it was a perfectly linear line, then that would mean in each period the cohort bought the same amount of goods as the previous period.
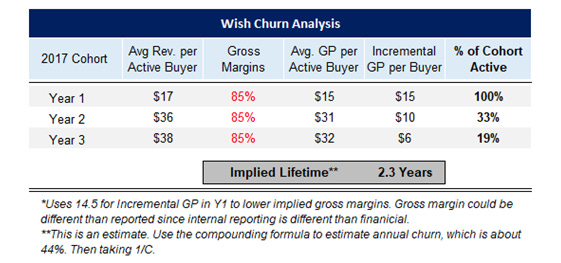
We will focus just on the 2017 cohort for simplicity. We annotated it to show how we estimated incremental gross profits. The average buyer from the 2017 cohort earns $15 in gross profits in year 1, which drops to $10 in year 2, and then to $6 in year 3. We can already see that by year 3, each cohort is generating about 1/3rd what it did in year 1, which suggests heavy churn. Remember that Wish’s payback period is about 2 years, which means it isn’t until year 3 they make that small incremental gross profit. And remember, this is just to pay back the initial marketing investment, not other S&M they spent on promotions to reengage that buyer.
From this chart we can see what the average revenue per active buyer is. Since the first chart counts all gross profits for the given cohort and this second chart shows us the average of only active buyers, we can back into how what percent of the cohort is still active. We similarly annotated the chart above where we guessed the average revenue per active buyer and fed it into the table below.
Here, we can see that that the difference between the gross profit for total buyers divided by the gross profit per average active buyer gives us a churn estimate. At the end of year 1, 100% of buyers are active (by definition) and by year three that drops to 19%. That comes out to about 44% annual churn over two years. It is also noteworthy that the churn is much worse in the first year. A full 67% of buyers do not return after buying once.
Now, remember that their average payback period is under 2 years. That is rather problematic in the context of almost no one being left after 2 years! They have a thin amount of remaining users that not only need to cover all of the reengagement marketing, but also all of their G&A and R&D cost. And that’s before they can even make a profit!
This is a fundamentally broken business. Users do not stay long enough, they have to pay to get users to return, and users are not profitable.
What Happened Next?
The Covid bump they got turned into a Covid headwind, and in a different funding environment they cut back on marketing which caused revenues to further fall. Marketplace revenues fell -34% in 2021, mirroring almost exactly their -35% y/y cut in S&M. At the end of 2021, CEO and Founder Peter Szulczewski stepped down from his post. 2022 proved much more brutal though. Wish would cut S&M -77%, which resulted in marketplace revenues plummeting -80% y/y. In April 2023, Wish’s parent company, ContextLogic, did a 30 for 1 reverse stock split as shares were literally trading for pennies. Today, they have about $450mn in cash, $220mn in liabilities, and, after many cuts, are still on track to burn ~$300mn a year. Their market cap is currently about $100mn, down 99.5% from their peak of ~$20bn.
What Is The Lesson?
Earlier we said that an explanation is a story that cannot easily vary. Well, we have trouble figuring out exactly what the story is that cannot vary. There is nothing in principle wrong with an ecommerce offering catered to the consumers in the low-end of household earnings. Some would note that the low average order value would make it hard to make enough contribution profit per order, but that is essentially what Pinduoduo did in China, what Shopee is doing in Southeast Asia and Brazil, and what Temu is doing in the US. While we don’t know exactly if all of those initiatives will end up being profitable, it is hard to claim it is the idea itself that is rotten.
Clearly, Wish had a problem with both their high cost to acquire users and their ability to retain them. We know that Pinduoduo had a better customer acquisition engine piggy backing off of Tencent’s Weixin with preferred placement and the Community Group Buy model was a novel way to spur consumer sharing, free of charge. Shein had TikTok and went viral early on with “Shein hauls”, where influencers would post everything they purchased. They would later lean into influencer marketing on TikTok to much success. Amazon has Amazon Prime which helps retain users, and their optimal customer service helps keep customers satisfied at potential churn events. Wish was lacking something in the customer acquisition and retention area, but exactly what isn’t obvious.
Perhaps it was a mix of everything that individually created customer churn events from slow shipping to “unreliable shipping”, fraud, fake listings, sub-par customer service, inadequate item selection, poor item quality, inaccurate recommendations, or perhaps even internal issues. But again, other companies have survived similar or worse issues. And the longer the list, the more it speaks to our lack of confidence in any one variable. As an investor from the outside, it isn’t apparent what the key problem was, at least not to us.
What is crystal clear though is that there were issues since at least 2019, and some red flags prior. An investor only needed the company’s IPO prospectus to see these problems brewing, and could have avoided even worrying about any potential “narrative fallacy” by just focusing on the financials.
Rewind a few years ago and I actually sat in on an IPO meeting with Founder and CEO Peter Szulczewski. When asked about the meeting, I remember saying, “I have not seen a single number yet so this could all change, but it is actually a very impressive company, and they have an interesting model”. I talked to that person later, and when they could tell my impression of the company had changed, they asked why?
I replied simply: “The numbers.”
If something doesn’t look right, don’t overcomplicate it.
For more content, check out our podcast, The Synopsis, here: Apple, Spotify
We will be talking about Wish in a future episode!
It is true that by time the 2020 10-K in March of 2021 that the stock would be down from its IPO value by about 30%. However, that was not because 4Q2020 showed anything an investor couldn’t have seen in 3Q2020 (last quarter when IPOed). We only use the full year 2020 because it is easier to compare.
Credit to David Deutsch for the concept.
If gross margins are assumed to be 80% we take 1/80% = 1.25. That means they need $1.25 in revenue to recoup enough gross profit cover the $1 they spent on S&M. We can take the 58 cents and divide by 1.25 to get about 2.2 years, which is the payback. The company would want the user to stay around longer in order to make money off of them.
This is very similar to Groupon’s original model where enough people had to join the deal in order for it to tip and everyone to receive the deal.















Great analysis, thanks for the post!
Great post!