Meta 1Q24 Business Update
AI proof points, fickle investor expectations, incredible operating leverage, simplified revenue build
Welcome to Speedwell Research’s Newsletter. We write about business and investing. Our paid research product can be found at SpeedwellResearch.com. You can learn more about us here.
We talk about Meta on our Podcast too. You can add our podcast feed here (Apple, Spotify).
If you are new to Speedwell Memos, welcome! We have pieces on Zara & Shein, Google’s AI risk, Why Wish Failed, Alibaba’s Accounting, What was priced into Home Depot in 1999, WeChat and Superapps, as well as many others! Also, if you haven’t already, check out our business philosophy pieces on The Piton Network (Part 1 and Part 2), as well as our Series on The Consumer Hierarchy of Preferences. A directory of our memos can be found here.
What you are reading right now is a business update for a company we have written an extensive research report on.
Intro.
Meta just reported 1Q24 and the stock opened down 15%.
The narrative floating around seems to attribute this move to a softer than expected revenue guide ($36.5-39bn versus analyst expectations of ~$38.5bn) and a slightly higher expense range floor (increased to $96-99bn from $94-99bn prior).
Whereas revenues contracted in 2022 and the market was pricing in 0-3% revenue growth in perpetuity at the beginning of 2023 (as shown in our reverse DCF in our full research report), now the 2Q24 guide of +15-23% y/y growth (FX neutral) is considered a disappointment.
While this speaks to how fickle investor expectations are, it also shows just how much Meta has improved their business in the last year.
1Q24 Results.
1Q24 revenues were +27% with expenses up +6%. That means for every incremental dollar of revenue Meta brought in, 84% fell to operating income, which is incredible operating leverage.
As CFO Susan Li notes below, they have continued to operate the business very efficiently since Zuckerberg’s “Year of Efficiency” and it is showing up in the numbers. Operating income is +91% y/y to $13.8bn.
Consolidated operating margins were 38%, up from 25% last year, driven by Family of App margins increasing 940bps y/y to 49% and Reality Lab losses staying flat.
The Family of Apps segment generated $17.6bn, which was somewhat washed out by their Reality Labs losses of $3.8bn.
Net income of $12.4bn translated into $4.71 earnings per share on a slightly reduced diluted share count (-20bps q/q).
However, given that capex continues to run well above D&A (the D&A to capex ratio over 2x), looking at earnings can be a bit misleading.
Free Cash Flow.
Capex continues to be a drag on cash flow as they “invest aggressively to support [their] ambitious AI research and product development efforts”. These AI infrastructure investments serve five main purposes.
First and foremost they helped improve ROAS (return on ad spend) after the signal was lost from Apple’s App Tracking Transparency privacy initiative. Along with with CAPI (conversion API), Meta was able to not just restore ROAS, but continue to improve it.
If you recall this was a key issue and risk with Meta a couple years ago: it was unclear if the increased capex would simply restore ROAS or actually allow it to grow beyond pre-ATT levels. The former suggest the increased level of capex (2022 capex was twice as high as 2020) was mere “maintenance capex”, whereas the latter would mean a portion of that capex was for growth and thus had an incremental return associated with it.
It is clear today that their AI initiatives not only allowed them to “solve” ATT with a suite of AI-enabled tools including Advantage+, but will allow them to increase the ROAS beyond what was possible in a pre-ATT world (that is not to say though that their ROAS wouldn’t be even higher without the ATT data restrictions).
The second key area AI serves is their recommendation systems. The Reels product inherently relies on a recommendation system as each video is suggested for a user based on what it thinks they’d like best. AI helps make suggestions more accurate.
Zuckerberg noted that 30% of the Facebook feed and 50% of the Instagram feed is now dictated by their AI recommendation system, which is up 2x over the past year. AI recommendations have been key to the success of Reels, which they disclosed now compromises 50% of time spent on Instagram.
Third, AI could help with ad generation by creating content for an advertiser. They rolled out their GenAI image tool for Facebook and Instagram Reels after introducing it to Instagram last quarter. They noted that they enjoyed “outsized adoption with small businesses”.
Helping small businesses make ads means more advertisers, which improves auction density and can push up ad prices. Offsetting that is by improving the ad quality Meta can help improve click through rates, which improves an advertisers ROAS and opens up more inventory thus decreasing prices.
The fourth area they are using their AI infrastructure for is LLaMA (Large Language Model Meta AI). This is a little more experimental, but the idea is that open sourcing this LLM will allow them to “inject” AI into their products with products like chat bots or AI agents. One potential monetizable product is charging businesses for an AI agents that offers customer service or can take orders.
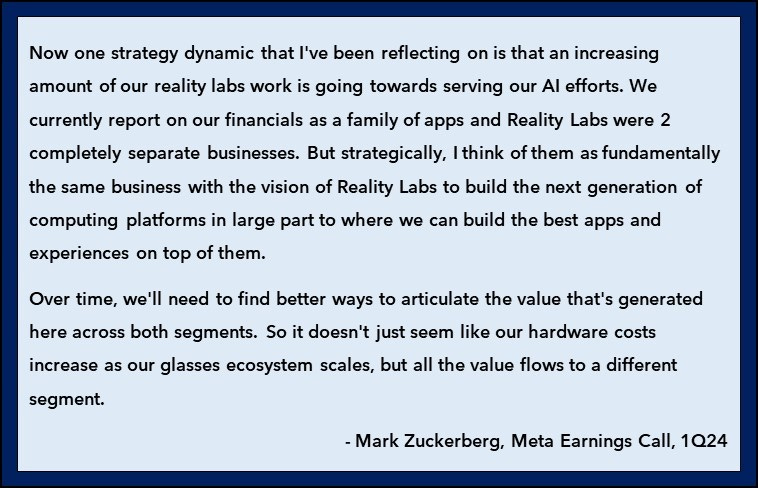
Fifth is it helps support their Metaverse and Augmented/ Virtual Reality work, which is housed in the “Reality Labs” segment. On the call Mark Zuckerberg points out that their AI efforts are becoming increasingly scrambled between their Reality Labs and Family of Apps segment. For instance, a Meta AI agent is available on their Ray Bans glasses, but the same work that helped create that could be used to talk to a chatbot on Facebook.
Zuckerberg comments on this dynamic below:
All of these AI initiatives are only made possible by an ever-increasing amount of capex. For 2024 they now expect to spend between $30-37bn in capex, a $2bn increase on the high end from their prior estimate.
While the return associated with this level of capex may have been drawn into question in 2022, when they initially hiked their internal investments, today we have evidence that these AI-related investments are strongly profitable.
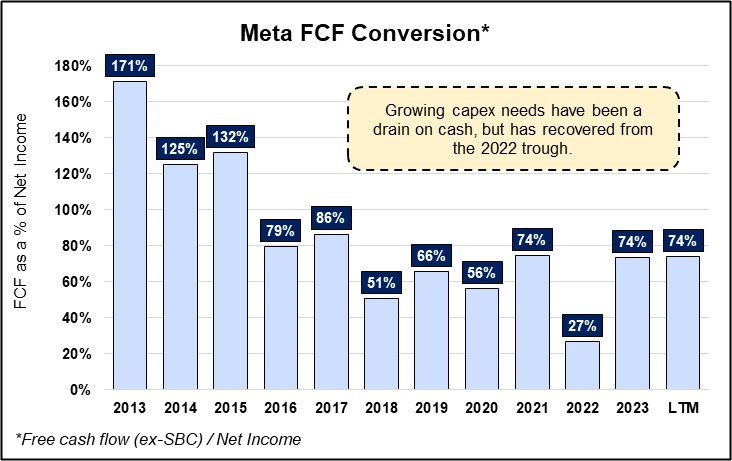
Free cash flow conversion has rebounded from its 2022 low and is now in the range of its recent historical average.
LTM free cash flow is $33.8bn when treating SBC as a cash expense. This is inclusive of a $16bn LTM loss from Reality Labs.
Simplifying Revenue Build.
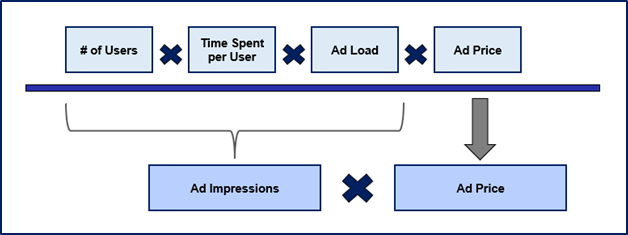
Readers of our Meta Research Report will remember this simple revenue build illustration.
We see that there are 4 revenue drivers. Let’s take them one by one.
# of Users.
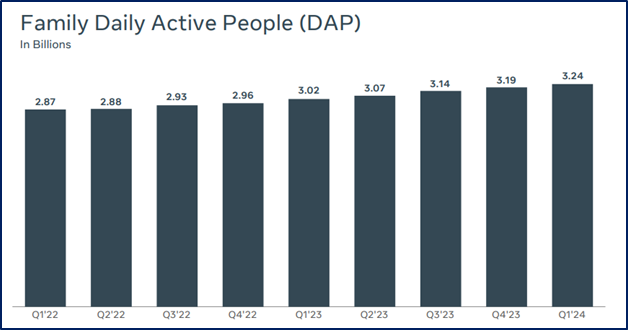
Daily active people reached a new high of 3.24bn. While it is possible that they have weaker user trends in certain geographies or among specific demographics, by and large it does not seem like there is any reason to worry about users fleeing today.
While it is true that the Facebook property still faces issues with attracting younger people, especially in the US (as outlined in our original report), Instagram does not suffer from that affliction. Additionally, recent commentary from the Morgan Stanley 2024 conference suggests that Facebook’s fate could be reversing.
Additionally, they also noted that WhatsApp has had “healthy growth” in the US with daily active users and messages sent gaining momentum.
In short, there is limited upside in regards to users growing with most of the internet-enabled world already on one of their properties, but also no signs that in aggregate they are at risk of losing users.
Time Spent.
While Meta does not disclose time spent, in 3Q23 they noted that time spent grew 7% on Facebook and 6% on Instagram as a result of recommendation improvements. It stands to reason that with their improved content recommendations time spent could have increased since, or at least stayed stable. Additionally, they noted in 3Q22 that “Reels is incremental to time spent on our apps” and Reels usage has only grown since then.
In theory it makes sense that as recommendation quality improves, users will spend more time on their apps. Additionally, there is the possibility that Tiktok will no longer exist in the U.S. if legal challenges to the recently passed Ban Tiktok Bill fail and Bytedance refuses to sell it, which could be a boon to time spent on Reels.
Ad Load.
This variable is essentially within Meta’s control… to an extent. They can’t place an insane amount of ads in their products that users churn, but that limit of how many ads a user will accept has been higher than most would of originally thought. This is in part because users actually enjoy some of the ads, provided they are relevant.
On the call Susan Li noted that they are “getting better at adjusting the placement and number of ads in real time based on our perception of a user's interest and ad content and to minimize disruption from ads”.
These three variables together dictate ad impressions.
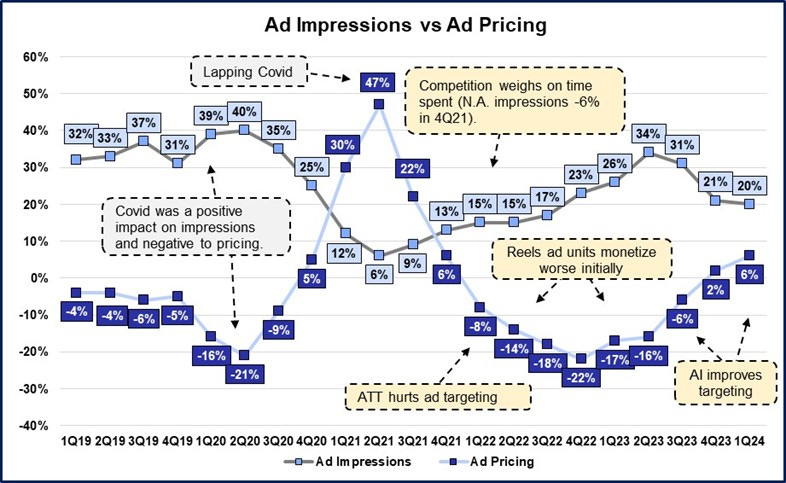
Overall, ad impressions grew 20% y/y. Ad prices grew 6%. Generally ad impression growth should be seen as a higher quality source of growth because to create additional impressions requires getting more users to use the product or to use the product for longer.
Since ad pricing is dictated by an auction, adding more ad impressions increases supply and thus generally lowers ad prices. Meta ad buyers are “ROAS-driven”, which means they are willing to pay up to a set amount for a given action (like a product sale or app download). The better ad recommendations Meta can give, the fewer ads that needs to be shown in order to get that “action”. The increased ad accuracy means there are more ad slots available and thus, again, more ad supply. This has the outcome of reducing ad prices, which then improves the advertisers ROAS. (We have a full discussion on this dynamic in our research report).
This quarter they also released a new disclosure on ad impressions by geography.
And the same disclosure for ad prices.
Below we will dive into our reverse DCF which shows what is implied at the current market price.
This is helpful as an investor can see how much growth they need (a risk) and what the associated return is. They can then tie that back to the revenue build above to see where they believe that growth is most likely to come from.
Alternatively, an investor can choose to think of the ad pricing variable as the potential ad targeting improvement (if you assume a flat ROAS, then any improvement in targeting is bid back up to the same ad price. We explain this dynamic more fully in our report.)
Reverse DCF.
As originally noted in our Meta Report:
Our approach to valuation is to invert the question. Instead of asking what a business is worth today, we estimate what is the implied business return at today’s market price. We do this through a reverse DCF, where we make various assumptions on a company’s future cash flows and then figure out what discount rate would make the sum of future discounted cash flows equal to the current market price.
The output of this analysis is a range of “discount rates” which can be thought of as your return on the purchase of business at today’s market price if you were to directly receive the excess cash flows (and the assumptions held). When we think of a company as under or overvalued, it is mathematically the same as saying the implied discount rate for the risk inherent in the business is too high (business is cheap) or too low (business is overpriced).
In our opinion, framing the opportunity in terms of discount rates makes it easier to conceptualize the investment opportunity and answer the question of if the return adequately compensates for the risk. (It can also keep an investor from making mistakes with multiples. In theory, a multiple is shorthand for a DCF, but it is commonly used out of convenience, leading to investors being blithely unaware of the assumptions that their multiple implies. Most commonly, the multiple makes implicit assumptions investors would be uncomfortable with were they to be explicit. The reverse DCF avoids this by making all assumptions explicit).
The rest of this update is accessible only to Speedwell Members.
If you are a Speedwell Member, click here to read the rest of this post.
If you are not currently a Speedwell Member, but wish to join, click here.
The Synopsis Podcast.
Follow our Podcast below. We have four episode formats: “company” episodes that breakdown in-depth each business we write a report on, “dialogue” episodes that cover various business and investing topics, “article” episodes where we read our weekly memos, and “interviews”.
Speedwell Research Reports.
Become a Speedwell Research Member to receive all of our in-depth research reports, shorter exploratory reports, updates, and Members Plus also receive Excels.
(Many members have gotten their memberships expensed. If you need us to talk with your compliance department to become an approved vendor, please reach out at info@speedwellresearch.com).

