
Investing is Just Answering a Series of Questions: Explaining the Reverse DCF
How to use a Reverse DCF

Welcome to Speedwell Research’s Newsletter. We write about business and investing. Our paid research product can be found at SpeedwellResearch.com. You can learn more about us here.
There is a podcast of this memo that is available if you prefer listening to it. You can find it on our podcast feed here (Apple, Spotify).

If you are new to Speedwell Memos, welcome! We have pieces on Sell-side Price Targets, Zara & Shein, Google’s AI risk, Why Wish Failed, Alibaba’s Accounting, What was priced into Home Depot in 1999, as well as many others! Also, if you haven’t already, check out our business philosophy pieces on The Piton Network (Part 1 and Part 2), as well as our Series on The Consumer Hierarchy of Preferences. A directory of our memos can be found here.
Intro.
All of investing is just asking a series of questions.
A valuation is a means by which you whittle down those questions to the most relevant and then attempt to answer them.
Despite what you might recall from an academic textbook, there is ultimately only one valuation framework.
“The intrinsic value of any business, if you could foresee the future perfectly, is the present value of all cash that will be ever distributed for that business between now and judgment day.
And we’re not perfect at estimating that, obviously. But that’s what an investment or a business is all about. You put money in, and you take money out.”
- Warren Buffett
Now there is different implementations of how to value a business, but all true valuation methods come back to that same idea that Buffett espoused above: A business’s intrinsic value is the sum of all cash flows discounted back to today.
The most common valuation methodology is a multiple-based approach. While it is easy to price stocks with a multiple, it is much harder to value them using a multiple.
This is because when you use a multiple-based valuation approach, the questions you are asking, and the answers you are getting, are much more opaque.
A DCF makes explicit what is implicit in a multiple-based approach. This allows much more clarity on the assumptions that an investor is making.
However, the DCF has problems too. That pesky discount rate, which despite what academics suggest, cannot be calculated… well it can be calculated just not in a way that makes sense.1 (More on cost of equity in this piece).
“The learned fool writes his nonsense in better language than the unlearned; but still 'tis nonsense.”
– Ben Franklin
Our solution at Speedwell Research is to use the Reverse DCF. But first we will touch on some common issues with a regular DCF.

What is a DCF?
The DCF is the vehicle by which an investor can formulize the answers to their questions and calculate what their associated return will be.
With a DCF, an investor can answer what they think the business’s 1) growth will be and for how long, 2) what mature profitability will look like and when they’ll get there, and 3) how long the business’s reinvestment run way will be and when cash will be returned to investors.
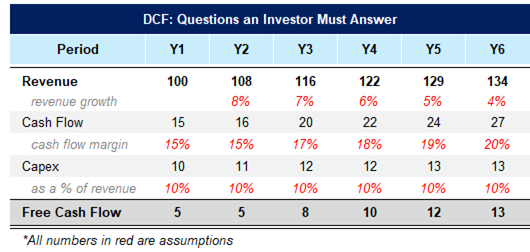
There are many different ways an investor can set up a DCF, but in the end it will always distill down to a series of cash flows. In the example below we see that the investor was asking the following three questions:
1) what will revenue growth be in each period?
2) what will normalized cash flow margin be in each period?
3) what will growth capex be as a % of revenue for each period?
The investor could have asked different questions if they wished, but since they set their DCF up this way, these are the questions they must produce answers to.
We usually call these answers assumptions. That is because the investor will readily admit that they do not know precise answers to the questions they are asking.
We can think of each assumption (the red numbers below) as existing on a probabilistic distribution. While the investor inputted revenue growth of 8% for next year, the real range of figures is wider.
A conservative investor will want to pick the highest number that they have high confidence in. In contrast, a growth investor may pick the highest number that they think is plausible. It is on each investor to use their judgement for what they want to assume, and it should be in line with their overall portfolio management strategy. (More on this idea here).
The point is not to pick a figure that you are 100% confident is correct, but rather an assumption you are very comfortable making. Reasonable people may disagree on what constitutes a fair assumption and your ability to get this correct overtime is essentially what will dictate whether you will become a great investor or not.
Up until now is usually the part that investors are okay with. Their trepidation stems from having to continue to project out far into the future where they feel they have less and less basis to make a prediction.
Usually, an investor will solve for this inhibition with a “terminal value”. This will allow an investor to only project a handful of years into the future explicitly and then slap down a formula to fill in the rest of the value.
They are commonly employed when an investor feels they can no longer defend their far-out assumptions, so they opt for a formula that appears to hide future assumptions. Make no mistake though, it doesn’t change what needs to happen with the business in order for you to get an adequate return.
Terminal values are simply themselves a shorthand for a DCF. Instead of modeling individual years of cash flows, they simply assume that cash flows are steady indefinitely. If you were queasy about modeling year 60 cash flows for a business, how do you feel about assuming it will be around forever?
It is somewhat ironic that the fear of projecting earnings many decades out culminates instead with investors essentially treating each business as a perpetual annuity. It would actually be more conservative to explicitly model each year of cash flow to year 60 than using a terminal value. This is because you can continue to adjust your assumptions down to make them more conservative in the out years and assume no cash flows after a certain period all together.
A multiple based approach has the same issues as a terminal value. In fact, a terminal value calculation is essentially a multiple approach as 1/ ( r-g ) yields a multiple of cash flow.

Now this doesn’t mean every multiple assumes cash flows continue indefinitely into the future, but rather you don’t know what it means! The same multiple can be justified by higher growth, higher profitability, or longer cash flow duration, but the investor typically has no idea what assumptions are embedded in the multiple. (We will write about this more in a future memo soon).
Below we make the point that you shouldn’t be scared of estimating cash flows far out into the future, because that is what you are doing anyway with a terminal value. The outputs might be similar in many cases, but isn’t it better to know your assumptions than not know?

In short, the only difference between different valuation methodologies is how explicit you make your assumptions. The desire to avoid making an assumption on year 35 cash flows doesn’t mean you actually avoid doing so, you just avoid becoming aware of what your assumption is.
We can sympathize with how baseless out year assumptions seem to be. However, instead of hiding our assumptions, we prefer to see how we will be rewarded for making various assumptions.
This is essentially what the reverse DCF does.

The Reverse DCF.
Remember, investing is just asking a series of questions and seeing what the associated payoffs are if that scenario materializes.
This is the beauty of a Reverse DCF. Instead of us picking specific growth rates and a discount rate that spits out a stock price value, we invert the process. We start with the current stock price and then sensitize around a range of assumptions (like revenue growth and margin for example). The output of the Reverse DCF is the discount rate that sets our DCF model equal to the current market value (or enterprise value).
This effectively allows us to see what return an investor can expect for making different assumptions. We want to know that if we assume a very high growth rate (which should be considered riskier) that the return we calculate is compensatory for that scenario. Conversely, if we use very conservative assumptions, we may want to see that we are at least clearing the risk-free rate.
The way Speedwell utilizes the Reverse DCF is to hone-in on usually two variables that we think are key drivers to the business. For Coupang we picked GMV and EBIT as a % of GMV, for Evolution we used revenue growth and EBIT margin, and for Constellation Software we picked reinvestment rate and ROIC of incremental capital deployed. This allows us to see what the return is for various assumptions and gives more clarity to the range of returns an investor can expect over the long term. (Speedwell Members have access to all our valuations and Members Plus can access the excels).

The Meta Reverse DCF.
To better understand how we use a Reverse DCF, we will use the actual DCF we ran for our Meta report, which was released in January 2023.
From our Meta report:
Our approach to valuation is to invert the question. Instead of asking what a business is worth today, we estimate what is the implied business return at today’s market price. We do this through a reverse DCF, where we make various assumptions on a company’s future cash flows and then figure out what discount rate would make the sum of future discounted cash flows equal to the current market price.
The output of this analysis is a range of “discount rates” which can be thought of as your return on the purchase of business at today’s market price if you were to directly receive the excess cash flows (and the assumptions held). When we think of a company as under or overvalued, it is mathematically the same as saying the implied discount rate for the risk inherent in the business is too high (business is cheap) or too low (business is overpriced).
In our opinion, framing the opportunity in terms of discount rates makes it easier to conceptualize the investment opportunity and answer the question of if the return adequately compensates for the risk. (It can also keep an investor from making mistakes with multiples. In theory, a multiple is shorthand for a DCF, but it is commonly used out of convenience, leading to investors being blithely unaware of the assumptions that their multiple implies. Most commonly, the multiple makes implicit assumptions investors would be uncomfortable with were they to be explicit. The Reverse DCF avoids this by making all assumptions explicit).
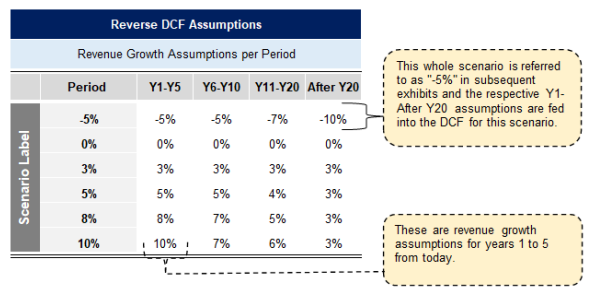
For Meta, there were many different scenarios that we wanted to sensitize around. However, the two critical variables were revenue growth and capex.
Below is the table that shows our revenue growth assumptions. In each growth scenario, we change the growth rates for Y1-5, Y6-10, Y11-20 and Y20+. There are 6 scenarios, and each scenario is labeled for the growth rate assumption in Y1-Y5.
The EBIT margin assumptions are below. The figures may seem a little random without full context as to why they were picked, but it is based off of various historical business performance coupled with some assumptions.

Below was Meta’s valuation at the time we ran our reverse DCF.

We put in each scenarios’ assumptions and then set the DCF equal to the current market cap to get the implied discount rate, or the business return.

These returns are what an investor could expect to earn if they owned Meta outright and all excess cashflows were returned to them over the life of the entire business. You can see that even with very conservative assumptions, the investor could have expected an above historical average stock market return. This analysis also fully burdens cash flows with $15bn of Reality Labs losses for 5 years and attributed zero value creation the Reality Labs segment.

Qualitatively Understanding the Reverse DCF.
As a research service that doesn’t give stock recommendations, we try to never be too explicit with our opinions, but that doesn’t mean we are unbiased. The below text is from our report (bolded text in the original report as well).
Interestingly, assuming 0% growth and a moderate margin scenario yields a ~9% return, which is about what equity markets have returned historically. While you would want an equity risk premium for an individual stock, we can see that the market is currently roughly implying that Meta is done growing forever. For context, this is a stock that has never grown less than 20% annually for its entire decade-long public history, prior to last year.
Looking now at our assumptions you may want to criticize them as being too conservative, but we don’t see it that way. At that point in Meta’s history and given the large stock drawdown, it allowed an investor to be very conservative and still see a sizeable premium above the historical stock market average return. The object isn’t to get the most accurate business performance on a short-term or even intermediate-term basis, but rather to figure out what assumptions can you have reasonably high confidence in.
We are not sell-side analysts concerned with accuracy of estimates. Instead, we are concerned with helping improve quality of decisions. The more unambitious the assumptions, the easier it is to have confidence in them. In practice this means that erring on conservatism means taking action becomes easier.
Naturally, because markets and stocks have volatility, knowledge is a great asset to have. Knowledge brings confidence, and confidence is what keeps people in stocks that are undergoing price pressures yet continue to have great growth in earnings.
Confidence is what helps successful investors to buy more shares when prices dip, while investors who do not know what they own become emotional and sell out of fear and lack of knowledge.
-Frederick Kobrick, The Big Money
Most investors were considering Meta’s business to be at existential risk at the time. So showing more conservative (if not draconian) assumptions helped frame to an investor how even uninspiring business performance could return decently.
It is the aim of a conservative investor to get comfortable with the lower range of potential outcomes and not worry themselves if things could be better. Of course, once Meta started showing stronger growth and incredible operating leverage, you could have conservatively increased your base assumptions, as you had more evidence to do so. (For those who would like to explore expectations in investing more in-depth, we would recommend checking out Michael Mauboussin's book Expectations Investing as well as his many research reports.)

Conclusion.
Do not forget your best advantage as an investor.
If you were betting on a basketball game, what is an easier bet to get correct?
Bet A: Guessing the exact total score at the end of the basketball game?
Bet B: Guessing at least how many points will be scored?
If the second bet seems too easy to get right, then great. We are not looking for fair fights here.
As an investor you are free to adjust your assumptions down until you are comfortable with them. Your reverse DCF will tell you what returns you can earn for various assumptions. Then you simply wait until an opportunity you like presents itself.
You may not commonly find scenarios that compensate you the way you wish but be patient. Overtime things you don’t expect to happen tend to happen.
(Now what you should set your hurdle at so you don’t miss too many opportunities is covered in this piece.)

The Synopsis Podcast.
Follow our Podcast below. We have four episode formats: “company” episodes that breakdown in-depth each business we write a report on, “dialogue” episodes that cover various business and investing topics, “article” episodes where we read our weekly memos, and “interviews”.

Speedwell Research Reports.
Become a Speedwell Research Member to receive all of our in-depth research reports, shorter exploratory reports, updates, and Members Plus also receive Excels.
(Many members have gotten their memberships expensed. If you need us to talk with your compliance department to become an approved vendor, please reach out at info@speedwellresearch.com).

If you aren’t ready to become a Speedwell Member yet, sign-up for our free content below!
Aswath Damodaran’s idea of calculating a company’s beta on their revenue or earnings volatility instead of stock price is a big improvement, but still lead to problems. Just think of Meta’s earnings from 2021 to 2024. You would have seen a huge swing in cash flows as they invested more through that period and cannibalized their own revenues with lower monetizing Reels versus other surfaces. The beta formula would suggest doing so made the company riskier, but would have not responding to the TikTok threat and forgoing capitalizing on the AI opportunity made them less risky of a company?
This is how you internalize the valuation process like Buffet. Must read for everyone regardless of experience. I have recently written about this. I will edit and add this to my post for my subscribers. Thank you.
Outstanding! I’ve used the reverse DCF for years. It’s always annoyed me when people whine about DCF’s being “garbage in, garbage out” or “too complicated and not useful”…. Any DCF value or model is almost INHERENTLY wrong, but that’s entirely irrelevant. It’s an abstraction of reality that allows you to simplify your thinking around the key drivers and the sensitivity of value to those different drivers. It helps you focus your time and effort where it will give you the most value. Reverse DCF takes that a step further and tells you what the market is telling you about the stock today. It might be right and it might be wrong, but you’d be a fool to ignore it. Figuring out where you have a differentiated view from the market and whether that view can be refuted is the name of the game. As Munger said, “Invert - always invert!”